Model 400B Series Time-Resolved Electrochemical Quartz Crystal Microbalance (EQCM)
Overview
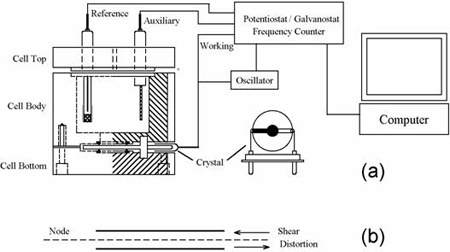
The quartz crystal microbalance (QCM) is a variant of acoustic wave microsensors that are capable of ultrasensitive mass measurements. Under favorable conditions, a typical QCM can measure a mass change of 0.1-1 ng/cm2. The QCM oscillates in a mechanically resonant shear mode under the influence of a high frequency AC electric field which is applied across the thickness of the crystal. Figure 1b shows an edge view of a QCM crystal that is undergoing shear distortion from the oscillation. The central portions of the top and bottom sides of the crystal are coated with a typically disk-shaped thin film of gold or other metals. The mass sensitivity of the QCM originates from the relationship between the oscillation frequency on the total mass of the crystal and the adlayers of materials residing at the metal-coated crystals, given by the Sauerbrey equation below:
A = area of the gold disk coated on the crystal
ρ = crystal's density (= 2.684 g/cm3)
μ = shear modulus of quartz (= 2.947 x 10¹¹ g/cm*s2)
QCM and the combination of QCM with electrochemistry (EQCM) have been widely employed for the determination of metals deposited onto the crystal, studies of ion-transport processes in polymer films, biosensor development, and investigations of the kinetics of adsorption/desorption of adsorbate molecules. In EQCM experiments, the measurements of the various electrochemical parameters, such as potential, current and charge at the working electrode, and the acquisition of the corresponding frequency change, can be conducted simultaneously with the experimental setup shown in Figure 1a. For any model in the CHI400B series, the application of a specific potential waveform (e.g., triangular potential waveform for cyclic voltammetric experiments) and the subsequent current measurements and frequency counting are carried out with a potentiostat/frequency counter, which is in turn controlled by a computer.
The CHI400B series contains a quartz crystal oscillator, frequency counter, fast digital function generator, high-resolution and high-speed data acquisition circuitry, potentiostat, and a galvanostat (Model 440B only). The QCM is integrated with the potentiostat and galvanostat, making the EQCM study simple and convenient. Instead of measuring the frequency directly, the CHI400B series uses time-resolved mode. The frequency signal of the QCM is subtracted from a standard reference frequency. Their difference is then measured by a reciprocal technique, which greatly reduces the time needed to sample the QCM signal and gives much better time resolution of the QCM signal. With the direct counting method, a 1 Hz QCM resolution requires 1 second of sampling time, and a 0.1 Hz resolution requires 10 seconds of sampling time. In contrast, time-resolved mode allows the QCM signal to be measured in milliseconds with much better resolution.
The potential control range of the instrument is ±10 V and the current range is ±250 mA. Besides QCM and EQCM measurements, the instrument also includes a wide range of other techniques useful for general-purpose electrochemical applications. The instrument is very sensitive and very fast, capable of measuring current down to the picoampere level. The scan rate in cyclic voltammetry can be up to 5000 V/s with a 0.1 mV potential increment or 10000 V/s with a 1 mV potential increment.
Figure 2 shows the voltammogram of underpotential and bulk depositions of Pb from a 0.1 M HClO4 solution containing 1 mM Pb2+, and the corresponding frequency changes have been plotted as a function of the applied potential. In Figure 2a, the cathodic peaks at –0.28 V and at ca. –0.59 V have been assigned to the underpotential deposition of monolayer Pb and the bulk deposition of multlayers of Pb, respectively, whereas the anodic peaks at –0.41 V and at –0.28 V are attributable to the stripping of the deposited Pb. The frequency-potential diagram (Figure 2b) displays the frequency decrease due to the deposition of monolayer Pb (about 25 Hz or 33.5 ng between –0.28 V and –0.59 V) and the more drastic frequency decrease arising from bulk Pb deposition (a net change of 425 Hz or 573.8 ng at ca. –0.5 V).
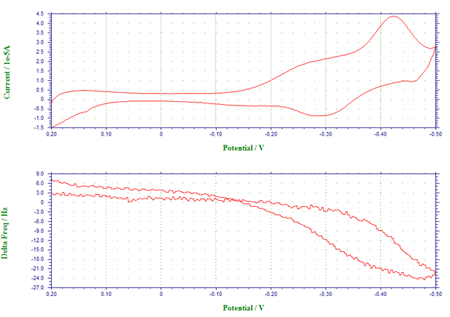
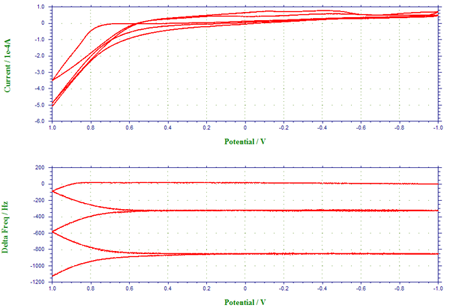
Figure 3 depicts the voltammogram of the oxidation of pyrrole to form polypyrrole film at the gold-coated crystal and the corresponding frequency change. Five scan segments between the lower limit of –1.0 V and the upper limit of 1.0 V were conducted in this experiment. As clearly shown in Figure 3a, pyrrole monomer can be oxidized to its radical at ca. 0.65 V. When this occurred, a thin polypyrrole film was formed, resulting in a decrease of the fundamental frequency of the quartz crystal (Figure 3b). During the first potential cycle, the net frequency change was found to be 1150 Hz. The frequency ceased to change, as the potential became insufficiently positive for the synthesis of polypyrrole film. The subsequent potential cycles displayed in Figure 3 demonstrate the continuous growth of polypyrrole film and the further frequency decrease or mass increase at the crystal. A fast scan rate (0.1 V/s) was employed.
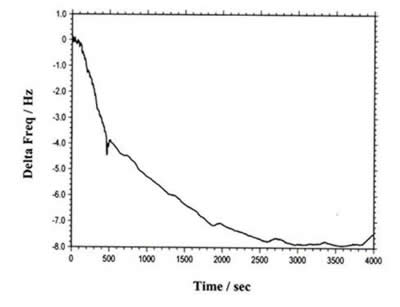
The instrument can also be used for regular QCM. Figure 4 shows the QCM data of flow cell detection. The total frequency change is less than 8 Hz. The long term drift and noise levels are extremely low.
The model 400B series is the upgrade to the model 400/400A series. The instrument utilizes flash memory, allowing instrument updates to be distributed electronically instead of the inconvenient shipment of an EPROM chip.
The 400B series has a USB port (default) and a serial port for data communication with the PC. You can select either USB or serial (but not both) by changing a switch setting on the rear panel of the instrument.
16-bit highly stable bias circuitry has been added for current or potential bias. This allows wider dynamic range in AC measurements. It can also be used to re-zero the DC current output.
The EQCM cell consists of three round Teflon pieces (Figure 1a). The total height is 37 mm with a diameter of 35 mm. The top piece is the cell top to hold reference and counter electrodes. There are also two 2 mm holes for manual purging. The center piece is the solution cell, and the bottom piece is for mounting purposes. Four screws are used to tighten the O-ring seal between the bottom and center pieces. The quartz crystal is located between the center and bottom pieces. The diameter of the quartz crystal is 13.7 mm. The gold electrode diameter is 5.1 mm.